Social media competitor analysis, from the outside
Five logos and a follower count is not analysis. Here is the version that produces a decision, and what nobody outside can see.
The competitor analysis most teams produce is a slide with five logos, a follower count under each and a sentence saying that one of them posts more than the others. It takes a morning, it is never opened again, and it answers no question anybody had. The useful version is smaller, slower and continuous.
This is the complete guide to social media competitor analysis: choosing the set, what is genuinely visible from outside, what to look for once you can see it, how often to look, and the four conclusions this exercise reliably produces if you do it properly.
TL;DR
| Question | Answerable? | From what |
|---|---|---|
| How often do they publish? | Yes | Public post dates |
| Is their audience growing? | Yes | Follower count over time |
| What are they talking about? | Yes | Reading the posts |
| Which posts landed? | Mostly | Public likes and comments |
| How many people saw it? | No | Owner only, at any price |
| Is it working commercially? | No | Not a social question |
Why the usual version fails
The one off competitor audit fails for a structural reason rather than a quality one. It captures a single moment, and almost every interesting thing about a competitor's social presence is a change over time rather than a state.
A follower count on its own tells you nothing. The same count read three months apart tells you whether they are growing, and at what rate, and that is a fact you can act on. A snapshot cannot produce it, and by the time somebody runs the audit again the earlier numbers have been lost.
The second failure is scope. A slide with five logos treats competitors as a set to be summarised, when the actual value comes from watching two or three of them closely enough to notice when something changes.
Everything worth knowing about a competitor's social presence is a derivative. A single reading has none, however many logos are on the slide.
Choosing the set, which is most of the work
The set of accounts you watch determines what the analysis can possibly tell you, and it is chosen carelessly far more often than it is chosen well. The instinct is to list the companies sales loses deals to. That is the right list for a battlecard and usually the wrong one here.
What you want is accounts doing the same job as yours on social, at roughly your size, whether or not you compete commercially. A company you never meet in a deal but who reaches your buyer every week is far more instructive than a direct rival whose social presence is dormant, because the thing being studied is the practice rather than the rivalry.
- Two or three direct competitors, the active ones. Skip anyone who posts twice a quarter. There is nothing to learn from silence.
- Two accounts that reach your buyer without competing. Adjacent products, publications, communities. Usually the richest source of format ideas.
- One account much better than you. Not to copy, but to see what the ceiling looks like and how long it took them.
- The people, not only the companies. In most markets the individual accounts out reach the brand pages by an order of magnitude, and they are the real competition for attention.
The fourth point reorders most competitor sets. Watching five brand pages while your buyer's feed is full of five named people is watching the wrong thing carefully.
What is actually visible from outside
This section saves the most time, because a large share of competitor analysis effort goes into trying to obtain numbers that do not exist outside an account at all. No vendor has them, whatever the pricing page implies. Products that display them are estimating from public signals, and an estimate presented as a measurement is worse than a blank cell, because a blank cell does not get quoted in a meeting.
| Metric | Visible on any account | Note |
|---|---|---|
| Posts and their dates | Yes | The most useful column, and free |
| Follower count | Yes | Only meaningful as a trend |
| Likes and comments | Usually | Read at a comparable post age |
| Video views | TikTok and YouTube | Defined differently on each |
| Shares and saves | Rarely | Do not build a process on these |
| Reach and impressions | Never | Owner only, on every network |
| Audience demographics | Never | Owner only, on every network |
The full map, network by network with the date each reading was taken, is in public social media metrics. It is worth reading before any tool conversation, because most competitor tooling questions turn out to be questions about this table.
The tooling question, answered in one section
Once the visibility table is clear, the tool decision is small. A product can do exactly three things here, and every feature list is one of them dressed differently.
- Read the accounts on a schedule. The valuable one, because it is the only part that cannot be done retrospectively.
- Keep the history. Equally valuable and even less demonstrable in a demo, since its whole benefit arrives in month nine.
- Compute comparisons on top. Genuinely useful and entirely reproducible in a spreadsheet once you hold the underlying readings.
What no product can do is show private metrics for an account it is not connected to. That is a network boundary rather than a gap somebody will close next quarter, so a vendor promising competitor reach is either estimating or misdescribing what they have. The shortlist, sorted by what each one can actually read, is in best competitor analysis tools for social media.
Where the line is, and staying on the right side of it
Reading what a company published in public is ordinary market research, and it is what every competitor does to you. It is worth being clear about the difference between that and the things that are not fine, because the distinction is simple and people worry about it more than they need to.
- Reading public posts and counts. Ordinary, and the whole of what this guide describes.
- Recording those readings over time. Also ordinary. Keeping a note of what you read is not a different activity from reading it.
- Fake accounts, or connecting under false pretences. Not research. It also produces nothing the public side did not already give you.
- Anything requiring a password that is not yours. Obviously out, and worth writing down once so nobody has to make the judgement alone.
The practical test is whether the same information would be available to a stranger reading the profile. If it would, the analysis is on solid ground. If it would not, no amount of competitive pressure makes it a good idea.
What to look for, once you can see it
With the visible columns established, the analysis is a small number of specific questions. Each one has an action attached, which is what separates this from a summary.
- Cadence, and whether it changed. A competitor going from weekly to daily has made a decision. A competitor going quiet has made a different one, and both are worth knowing within weeks rather than at the next audit.
- Who is posting. A shift from the brand page to named employees is the single most common strategic move in this space, and it is visible immediately.
- Which subjects earn comments. Not which posts got most likes. Comments are the expensive reaction and they show what an audience will argue about.
- Formats that keep recurring. Anything a competitor repeats for three months is working for them, because nobody sustains a format that does nothing.
- Where they are absent. The network nobody in your market has taken seriously is more actionable than the one everyone is fighting over.
The last is underused. A market where every competitor is on one network and none of them is anywhere else is a market with an unclaimed channel in it, and that finding is worth more than any amount of detail about the crowded one.
How often to look
Continuous capture, periodic analysis. Those are two different activities with two different rhythms, and conflating them is the reason competitor tracking either eats a day a week or does not happen at all. Separated, the expensive half runs four times a year and the cheap half runs by itself.
| Activity | How often | How long |
|---|---|---|
| Recording what they published | Daily, ideally automatic | None, if automatic |
| Glancing at the set | Weekly | Five minutes |
| Reading their best posts | Monthly | Half an hour |
| Writing an actual analysis | Quarterly | Half a day |
The first row is the one that has to be automatic, because it is the only one that cannot be caught up later. A history nobody captured in March is gone, and no product can retrieve it in November. The procedure for setting that up, by hand or otherwise, is in tracking competitor social media.
Turning readings into an argument
The quarterly analysis is a written document, not a dashboard, and it should be short enough that somebody reads all of it. Four paragraphs is a good target, and each one answers a question that has a decision behind it. The numbers underneath it come from the wider practice described in social media analytics, and none of them mean anything without the paragraph.
- What changed in the set this quarter? Cadence, people, subject, network. Changes only, not a status summary.
- Where are we relative to them, on the two comparable numbers? Posts published and follower trend, at a comparable size.
- What are they doing that we should test? One thing, not five, and with a date.
- What are they not doing? The gap is usually the most valuable paragraph and the shortest.
The comparison against your own numbers has one rule that keeps it honest: compare against accounts of roughly your size, because reach does not scale linearly with audience and a comparison against somebody ten times larger produces no action. The method is in how to benchmark social media performance.
The timing problem that quietly ruins comparisons
There is one measurement detail that invalidates more competitor comparisons than any other, and it has nothing to do with which tool is used. Reactions keep accumulating for weeks after a post is published, so a post read on day one and the same post read on day sixty are two different numbers.
If you read your own account today and a competitor's account today, you are comparing their older posts against your newer ones, or the reverse. The gap is large enough to reverse a conclusion, and it is completely invisible in the resulting chart.
- Compare posts at a comparable age. Thirty days is a reasonable convention and any convention beats none.
- Or read continuously. A daily reading records each post as it matures, which removes the problem instead of correcting for it.
- Never compare a fresh scrape to a stored history. That is the version of this error that looks the most rigorous and is the most wrong.
- Write down which convention you used. In a year nobody will remember, including you.
The same effect distorts every reaction based comparison, which is one more reason the reaction hierarchy matters as much as the totals do. What each kind of reaction is worth is set out in social media engagement.
Four ways this goes wrong
All four are common, and three of them produce a document that looks perfectly respectable while being useless.
- Copying the leader. Their audience was built over years by a different company with different people. The format is transferable, the position is not.
- Reading a single quarter as a trend. Social numbers are noisy and one post that travels distorts a whole quarter. Two quarters minimum before concluding anything.
- Comparing across sizes. An account ten times larger is not a target, it is a different sport, and the comparison mostly generates despondency.
- Confusing activity with results. A competitor posting daily may be winning or may be burning out a team. Volume is a fact, not a verdict.
The first is the expensive one, because it produces months of work aimed at an outcome that was never available to you in the first place. What the exercise is actually for is finding the thing nobody in your market is doing, and that requires reading the set rather than ranking it. A ranking is what gets presented, a reading is what changes anything, and only one of those takes a morning.
How Groowth does this
Groowth handles the row that has to be continuous. You paste the public handles of the accounts in your set, companies and people, and it reads each profile once a day: what was published and when, the follower count, and the public likes and comments on each post. Nothing is connected and nobody is notified.
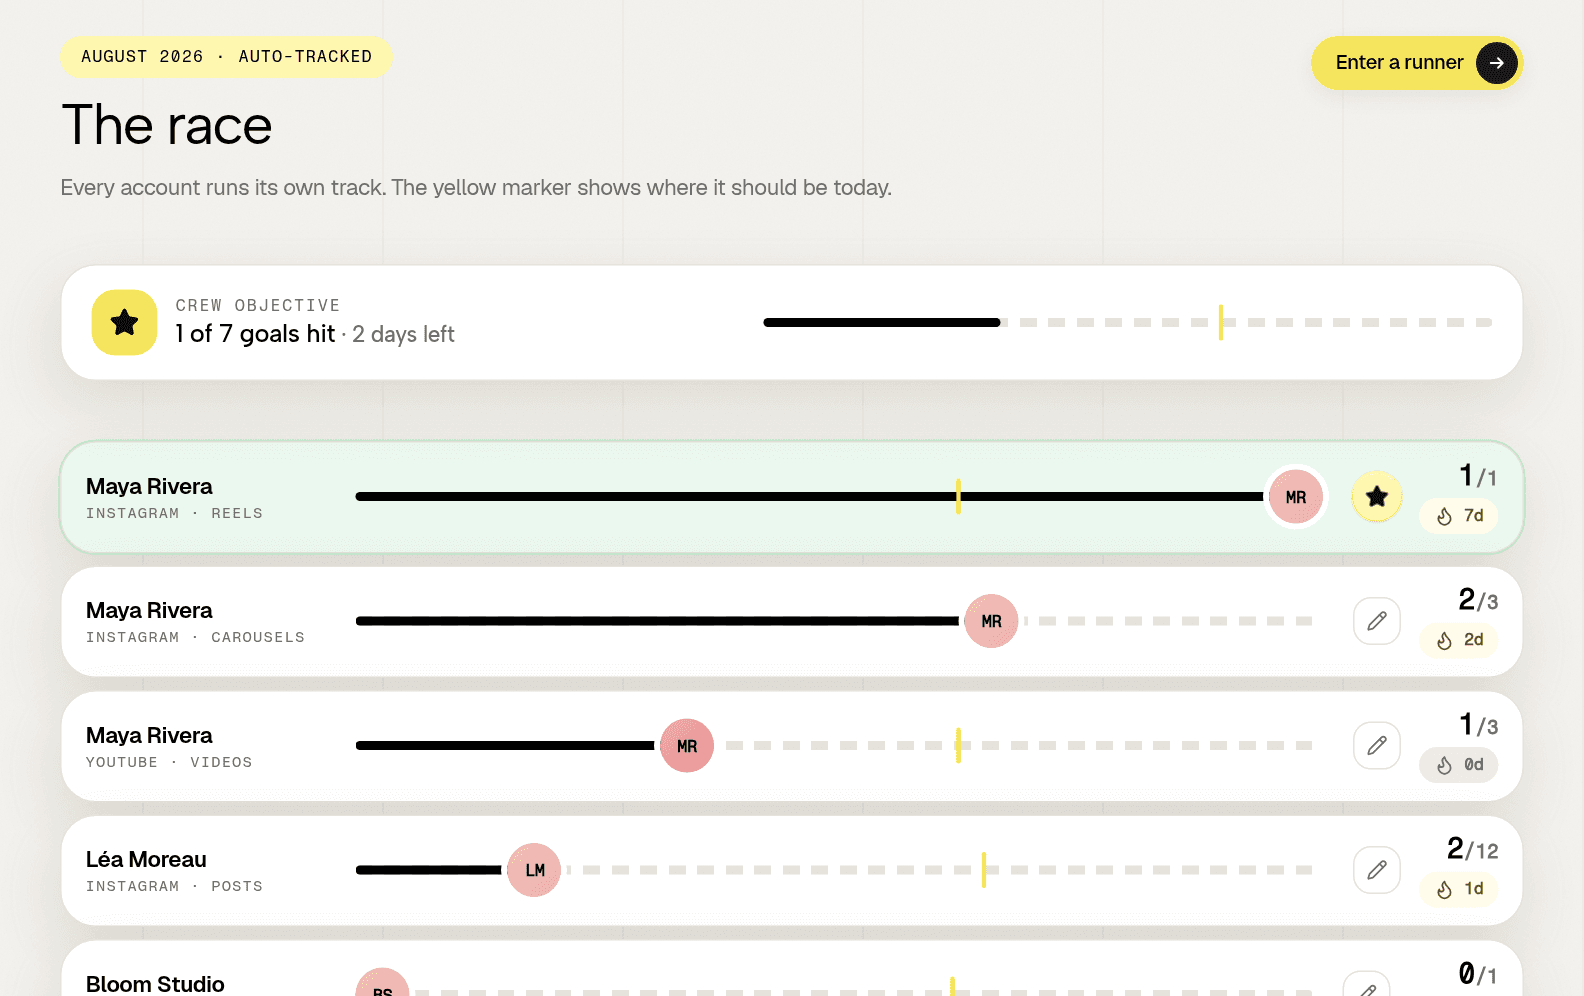
Because the reading is daily, the follower trend and the post age problem both take care of themselves, which a one off scrape cannot do. It never shows reach, impressions or demographics for a competitor, because nobody outside an account can see them and a product that displayed them would be inventing a number. Three accounts are free with no card, and a free audit reads one public profile with no account at all.
Frequently asked questions
What can you see about a competitor's social media?
Posts and their dates, follower counts, public likes and comments, and video views on TikTok and YouTube. Reach, impressions and audience demographics are given to the account owner only, so no product can supply them for a competitor.
How often should you analyse competitors on social media?
Capture daily and analyse quarterly. Everything worth knowing is a change over time, so the recording has to be continuous, while the actual analysis is a short written document produced four times a year.
Which competitors should you actually track?
Two or three active direct competitors, two accounts that reach your buyer without competing, one account clearly ahead of you, and the individual people posting in your market, who usually out reach every brand page in it.