Social media analytics, from first principles
Four dashboards, none of which answers the question you were asked. Here is the whole field, and where the real line sits.
Every network hands you a dashboard, every dashboard shows a different set of numbers, and none of them tells you whether the last three months went well. That gap is where most social media analytics work actually happens, and almost none of it is in the dashboards.
This is the complete guide to social media analytics: what the field covers, which numbers are real, which ones you can see on accounts you do not own, what a stack looks like at each size, and the mistakes that quietly waste the first quarter.
TL;DR
| The question | What answers it | Where it comes from |
|---|---|---|
| Did we publish? | Posts per account per week | Anywhere, free |
| Is the audience growing? | Ninety day follower trend | Anywhere, free |
| Did anyone react? | Likes, comments, shares | Public on most networks |
| How many people saw it? | Reach and impressions | Account owner only |
| Who are they? | Audience breakdown | Account owner only |
| Did it make money? | Attribution, and honesty | Your own systems |
What social media analytics actually is
Social media analytics is the practice of turning what accounts published, and what happened next, into a record somebody can act on. That is a deliberately small definition, and it is smaller than the one most tools sell. It leaves out sentiment scoring, it leaves out predicted reach, and it leaves out anything a vendor computes from a model you cannot inspect.
It matters because the field is usually described as a technology problem when it is a bookkeeping problem. The hard part is not computing an engagement rate. The hard part is having a complete, comparable, uninterrupted history of what happened, so that when somebody asks about March in November there is something to look at.
Almost every failure in this discipline is a hole in that record rather than a missing feature. A team with four honest columns going back a year can answer far more questions than a team with forty columns going back six weeks.
- Capture. What was published, by whom, when, and on which surface. Nothing else works without this.
- Measurement. The counts attached to each of those, read at a consistent moment rather than whenever somebody remembered.
- Comparison. The same numbers over time, and against other accounts doing the same job.
- Interpretation. The sentence a human writes at the top, which is the only part a tool cannot do.
Analytics is a record keeping discipline wearing a dashboard. The interesting question is never which chart, it is what happened in the month nobody was watching.
The two halves nobody separates at the start
There are two entirely different jobs under one word, and confusing them is the single most expensive mistake in this field. One is measuring accounts you control. The other is measuring accounts you do not.
On accounts you control, the network gives you everything: reach, impressions, saves, click through, audience demographics, the lot. There is no data problem. There is a collection problem, because that data lives in four different apps behind four different logins and it expires.
On accounts you do not control, which includes competitors, prospects, partners, industry voices and, crucially, your own colleagues posting from their personal profiles, none of that exists. What is left is the public surface, and the whole craft is knowing exactly how much that surface can tell you.
| Job | Data available | Real constraint |
|---|---|---|
| Accounts you own | Everything the network records | Getting it out, on schedule |
| Accounts you do not | Whatever is public | Knowing where the line is |
| Colleagues' own profiles | Public only, in practice | Nobody will connect them |
The third row is the one that surprises teams. A personal profile is technically an account somebody owns, but they own it, not you, and asking twelve colleagues to connect a work tool to their personal account fails in a predictable way. In practice it behaves exactly like a competitor's account, which is why founder led marketing is measured from outside.
The metrics, ranked by how long they survive
Not all numbers age equally. Some mean the same thing in two years as they do today. Others are redefined by a platform without warning, or mean different things on different networks, and any chart that adds them across networks is quietly averaging unlike things. A metric you can still interpret after a platform ships a redesign is worth more than a metric that is precise this quarter and meaningless the next.
Here is the ranking that actually matters, from the ones worth building a history on to the ones worth glancing at.
- Posts published. Unambiguous, comparable everywhere, entirely within your control, and the strongest predictor of everything below it. It is also the one nobody tracks.
- Followers, over ninety days. Slow, honest and comparable. Read weekly on a small account it is pure noise, which is why so many teams conclude the number is useless.
- Comments. The most expensive reaction a human can give, and the hardest to buy. On any account under fifty thousand followers this is the signal.
- Likes. Cheap, plentiful, and useful only as a ratio against followers, never as a total.
- Video views. Real, public on TikTok and YouTube, and defined differently by every network, so never add them together.
- Reach and impressions. The two most requested numbers in the field, invisible from outside any account, and defined differently in each network's own documentation.
The arithmetic that turns those into a rate, and the three different denominators people use for the word engagement, is in how to calculate engagement rate. Pick one denominator, write it down, and never change it, because the month it changes the history stops being comparable.
Where the line between public and private sits
This is the section that saves an afternoon, and sometimes a quarter. A great deal of effort in this field goes into trying to obtain numbers that do not exist outside an account, at any price, from any vendor. No product has them. The ones that appear to are estimating, and an estimate presented as a measurement is worse than a blank cell.
| Metric | Your own account | Any other account |
|---|---|---|
| Posts and their dates | Yes | Yes |
| Follower count | Yes | Yes |
| Likes and comments | Yes | Usually |
| Video views | Yes | TikTok and YouTube |
| Shares and saves | Yes | Rarely |
| Reach and impressions | Yes | Never |
| Audience demographics | Yes | Never |
The full map, read network by network with the dates each reading was taken, is in public social media metrics. It is worth reading before choosing a tool, because half of the tool comparison questions people ask turn out to be questions about this table.
The stack, at four sizes
There is no single right stack, but there are four situations and each one has an obviously correct answer. Most overspending happens when a team buys the stack for the situation above theirs.
- One or two accounts you own. Native analytics, and nothing else. Every network gives you more than a paid tool can, for free. Revisit when the copying starts to annoy you.
- Three to ten accounts, one brand. A free tier or a spreadsheet. Check what the plan cap counts before you build a workflow on it, because some count networks and some count profiles.
- Several people posting under their own names. Something that reads public profiles, because personal accounts are the ones nobody connects and a manual sheet decays exactly when it matters.
- Accounts you do not own at all. Something that reads public profiles, or accept that competitor tracking will be done from memory, which is what usually happens.
A spreadsheet is a legitimate destination and not only a stepping stone. It is free, it never changes its pricing, and it is the only option that keeps working when a vendor is acquired. It is worth choosing on purpose rather than defaulting into it, and the sorted comparison of what each kind of product can actually read is in best social media analytics tools.
How often to look, and at what
Looking too often is the most common way to draw the wrong conclusion. Social numbers on a young account are noisy at daily resolution and a daily chart will invite you to explain randomness. Three rhythms cover almost every team.
| Rhythm | What you look at | The question |
|---|---|---|
| Weekly, five minutes | Posts published per account | Did we do the thing? |
| Monthly, thirty minutes | Followers, comments, top posts | Is it working? |
| Quarterly, half a day | Everything, against benchmarks | Should we keep doing it? |
The weekly rhythm is the one worth defending, because it is the only one that catches a programme dying while there is still time to fix it. Cadence collapses before the numbers do, usually by a month, and the pattern is described in social media posting consistency.
Whatever the rhythm, read at the same moment each time. Counts keep moving after publication, so a Monday reading and a Thursday reading of the same week are not comparable, and a history assembled from whenever somebody remembered will show a pattern that is really a scheduling artefact.
The quarterly review is where comparison against other accounts belongs. Comparing yourself to yourself tells you whether you improved. Comparing yourself to five accounts doing the same job tells you whether improving was enough, which is a different and more uncomfortable question.
Where analytics stops and attribution begins
Sooner or later somebody asks what the social programme is worth in revenue, and the honest answer is that no analytics product can tell them. The networks do not pass a reader identity to your site, dark social carries a large share of the clicks that matter, and the buyer who read nine posts over four months arrives through a search for your brand name.
That is not a reason to give up on the question. It is a reason to answer it with the two cheap instruments that do work, and to stop paying for the ones that only appear to.
- Ask, in one field. A how did you hear about us box on the signup form outperforms most attribution software, costs nothing, and captures the dark social share that nothing else sees.
- Count branded search. A social programme that is working shows up as people searching your name. It is slow, it lags by months, and it is very hard to fake.
- Watch the shape, not the click. Rising comments from people with the job title you sell to is a better leading indicator than a click count, and it arrives earlier.
- Never let a tool invent the number. A vendor that reports social revenue is modelling it. Ask what the model assumes before quoting the figure to anybody.
The practical consequence is that a social report should lead with what the team controlled and what changed, and treat revenue as context rather than as the headline. What that looks like on a page somebody else reads is in how to build a social media report.
Six mistakes that waste the first quarter
All six are common, none of them are visible while you are making them, and every one of them is free to avoid if somebody names it before you start.
- Tracking thirty columns. A wide sheet gets abandoned in the first busy month. Four columns that answer a question somebody asks out loud get filled for years.
- Reading engagement without reading followers. Absolute likes rising while the audience doubles is a decline, and every dashboard will draw it as growth.
- Capturing counts once. Likes and views keep moving for weeks after publication, so a post read on day one and the same post read on day sixty are two different numbers.
- Starting with the accounts you own. They are the ones already covered for free. The accounts that justify the work are the ones nothing native reaches.
- Changing a definition mid year. The month engagement rate switches denominator, the history quietly stops being comparable and nobody writes it down.
- Reporting numbers without a sentence. A report with no interpretation is a data dump, and the person receiving it will invent their own interpretation instead.
The fourth reorders whole projects. Teams build the sheet for their own brand page, discover the native app already said all of it, and stop. What earns its keep is the half nothing else covers, whether that is a competitor set or twelve colleagues posting under their own names.
How Groowth fits into this
Groowth does one half of the field: the accounts nothing else reaches. You paste public handles on LinkedIn, TikTok, Instagram and YouTube, and it reads each profile once a day, recording what was published and when, the follower count, and the public likes and comments on each post. Nothing is connected and nobody signs in, including the people being tracked.
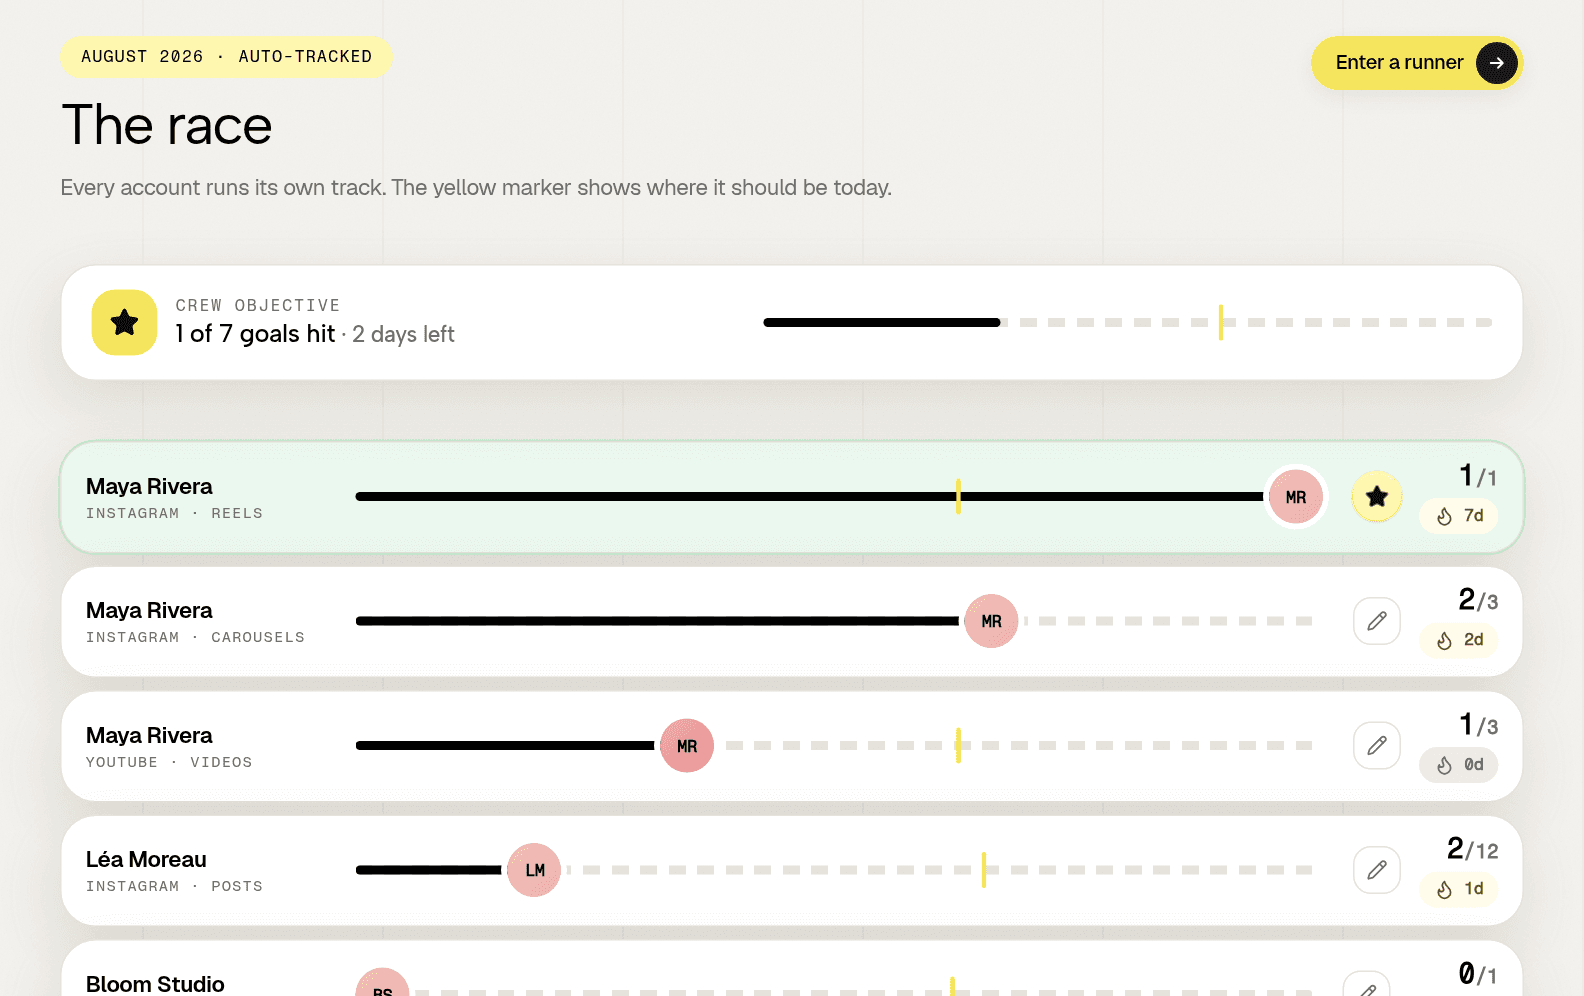
Because there is no connection, an account you do not own behaves exactly like one you do. It never shows reach or impressions, because those are the two rows in the table above that nobody outside an account can see, and a product that displayed them would be estimating. Three accounts are free with no card, and a free audit reads one public profile with no account at all.
Frequently asked questions
What is social media analytics?
It is the practice of recording what accounts published and what happened next, in a form somebody can act on. In practice it is a bookkeeping discipline: the hard part is an uninterrupted, comparable history, not computing a rate.
What can you measure without access to an account?
Posts and their dates, follower counts, public likes and comments everywhere, and video views on TikTok and YouTube. Reach, impressions and audience demographics are given to the account owner only and no product can supply them.
How often should you review social media analytics?
Weekly for five minutes on posts published, monthly for half an hour on followers and reactions, and quarterly against other accounts. Daily reading on a young account is noise and will make you explain randomness. Read at the same moment each time, because counts keep moving after a post goes out.