Social media engagement, defined properly
The same account, two rates, a factor of twenty apart. Here is what the word covers and which reactions are worth anything.
Two people compare engagement rates. One divides reactions by followers, the other divides by impressions, and the numbers differ by a factor of twenty. Neither is wrong and neither says so. That is the state of the most quoted metric in the field, and it is why most engagement comparisons are meaningless.
This is the complete guide to social media engagement: what the word covers, which reactions actually mean something, how the rate is computed and why the denominator decides everything, what genuinely moves it, and why chasing the number directly makes accounts worse.
TL;DR
| Reaction | What it costs the reader | What it tells you |
|---|---|---|
| A view | Nothing, often nothing at all | Almost nothing |
| A like | A second | It was legible and inoffensive |
| A save | A decision | They intend to come back |
| A share or repost | Reputation | They will stake their name on it |
| A comment | Words, in public | They had something to say |
| A message | Effort, privately | The actual outcome |
What the word actually covers
Engagement is a bucket word for every action a reader can take on a post that is not simply seeing it. That is genuinely all it means, and the trouble starts because each network fills the bucket differently, changes what is in it without announcement, and none of them says so anywhere near the number on the dashboard.
On one surface a click counts. On another it does not. Some include follows generated by the post, some include profile visits, some quietly include a view of more than a certain duration. Two tools reading the same account can therefore report engagement numbers that differ by half without either of them being incorrect.
The practical response is not to find the true definition, because there is not one. It is to pick a definition, write it down where the numbers are kept, and hold it for at least a year. A definition that drifts in July makes the first half of the year unreadable, and nobody ever writes down the day it changed.
An engagement rate without a stated denominator is not a metric. It is a number with a percent sign after it.
The hierarchy of reactions
Treating every reaction as one engagement is the second structural error, and it is baked into almost every dashboard because summing is easy. In reality the reactions differ enormously in what they cost the person giving them, and cost is exactly what makes a signal informative.
A like costs a second and no reputation. A public comment costs words, in front of the person's own network, attached to their name. A share costs more still, because it puts their credibility behind yours. The cheap signals are abundant and weak, the expensive ones are rare and strong, and the total treats them as equal.
- Under fifty thousand followers, comments are the signal. They are hard to buy, hard to accumulate by accident, and they correlate with the things you actually want.
- Likes are useful only as a ratio. As a total they mostly measure how many people saw the post, which is a different metric wearing a disguise.
- Saves are the most underrated. A save is somebody deciding this is worth returning to, which is close to intent.
- Shares are the only compounding reaction. They put the post in front of an audience you do not have, which is the mechanism behind everything that ever travelled.
- Messages are the outcome. Nobody reports them, they do not appear in any dashboard, and they are the reason most people are doing this.
A useful habit is to record comments as their own column rather than folding them into a total. It takes no extra effort, it survives every definition change, and it is the column that turns out to matter when somebody asks what was working in the spring.
The rate, and why the denominator decides everything
An engagement rate is reactions divided by an audience measure, and there are three audience measures in common use. They produce wildly different numbers from identical data, and which one a tool uses is rarely visible.
| Denominator | Typical size | When it is the right one |
|---|---|---|
| Followers | Largest | Comparing accounts from outside |
| Reach, or distinct people | Smaller | Judging the post itself |
| Impressions | Smallest rate | Almost never, on its own |
Rate by followers is the only one computable for an account you do not own, which makes it the default for any comparison across accounts. Rate by reach is the better measure of whether a post was good, and it is available only to the owner. Rate by impressions produces the smallest number and is the one most often quoted when somebody wants the figure to look modest.
The arithmetic, worked through with examples, is in how to calculate engagement rate, and the difference between the two audience measures the networks report is in reach against impressions.
What actually moves engagement
Most published advice on this points at surface features: post at nine in the morning, use three hashtags, ask a question at the end. Those effects are small, they are network specific, and they expire whenever a feed is retuned. Four things move engagement durably and none of them are tactics.
- Specificity. A post about a real situation with real details outperforms a general observation on the same subject, consistently, on every network.
- Being early or being contrary. A post that says something the reader has not already read twice today gets a reaction. Agreement is not interesting enough to comment on.
- Showing up often enough to be recognised. The same post from a familiar name performs better than from an unfamiliar one, which is why cadence is the underrated variable.
- Replying to every comment. It doubles the comment count mechanically and it makes the next post more likely to get one. Almost nobody does it consistently.
The third is the one teams underinvest in, because it is slow and it does not feel like a lever. It is covered in social media posting consistency, which is also where the decay pattern that precedes an engagement drop is set out.
Why chasing the number makes accounts worse
Engagement is easy to increase and hard to increase usefully, and the gap between those two is where a great many accounts quietly ruin themselves. Every network has formats that reliably generate reactions from people who will never become anything else.
Ask people to comment a single word and they will. Post something mildly provocative about a topic unrelated to your work and it will travel. The numbers go up, the account's audience shifts toward people interested in that instead of in you, and six months later the engagement rate is high and nothing comes of it.
- Engagement bait. Works immediately, trains the audience that your posts are not worth reading properly, and is increasingly demoted by the networks themselves.
- Pods and reciprocal commenting. Inflates the number with people outside your market, and it is visible to anybody who reads the comments.
- Chasing a viral format. One post that travels to the wrong audience can measurably damage the next ten.
- Optimising per post. The unit that matters is the quarter. Individual post variance is enormous and mostly luck.
The test that cuts through all of it is to ask who is reacting rather than how many. Twenty comments from people with the job title you sell to is a better month than four hundred from strangers, and no dashboard will ever tell you which one you had. Reading the names under your ten best posts once a quarter takes twenty minutes and is worth more than any engagement chart, because it is the only check on whether the audience you are building is the one you wanted.
Measuring engagement on accounts you do not own
This is where the metric becomes genuinely useful, because it is one of the very few things visible from outside an account. Likes and comments are public on most networks, which means a competitor, a colleague or a prospect can be measured on the same basis as your own account.
| Input to the rate | Your account | Any other account |
|---|---|---|
| Likes and comments | Yes | Usually |
| Shares or reposts | Yes | Sometimes |
| Saves | Yes | No |
| Followers | Yes | Yes |
| Reach or impressions | Yes | Never |
The bottom row is why rate by followers is the only comparison available across accounts, and the fourth row is why it works at all. The complete map across every network is in public social media metrics.
One caution about timing. Reactions accumulate for weeks after a post goes out, so a post read on day one and the same post read on day sixty are two different numbers. Any comparison between accounts has to read them at a comparable age, or it is measuring how recently each one posted.
Why engagement is not comparable across networks
A rate of two percent means something different on every network, and the differences are structural rather than cultural. They come from how much of the audience a feed shows a post to, and from which actions the network counts at all.
Networks that distribute mainly to followers produce rates anchored to follower count. Networks that distribute mainly by recommendation show posts to people who follow nobody involved, which makes a rate by followers behave strangely and sometimes exceed a hundred percent. Both numbers are correct and they are not the same quantity.
- Never average a rate across networks. The result is arithmetic performed on unlike things and it will be quoted for years.
- Keep one row per network, always. More rows, less impressive, and the only honest option.
- Compare a network to itself over time. That comparison is valid and it is the one that answers whether the work is improving.
- Expect video surfaces to look different. Where distribution is recommendation led, follower count stops being the denominator that means anything.
This is the reason a combined engagement figure in a monthly report is almost always the weakest number in the document, even though it is usually the largest and the easiest to compute.
The number that has to sit next to it
Engagement read on its own is misleading in one specific and very common way, and it is worth stating plainly because every dashboard invites the mistake. Absolute reactions rising while the audience grows faster is a decline, and it will be drawn as a rising line.
An account that doubles its followers and increases its likes by a third has become materially less interesting to the people following it. That is a real and actionable finding, it usually shows up months before anything else does, and it is invisible unless the two numbers are read together.
| What you see | What it might be | What settles it |
|---|---|---|
| Likes rising | Growth, or dilution | Followers over the same window |
| Likes flat | Stall, or a bigger audience | Rate over ninety days |
| Comments falling | Format drift | Which posts got them before |
| One huge post | Luck, usually | The quarter, not the month |
The habit that prevents almost all of this is to record followers in the same row as reactions, every week, from the beginning. It costs nothing at the time and it is impossible to reconstruct later, because nobody keeps a history of what an account's follower count was in March.
Benchmarks, and the size effect nobody adjusts for
Published engagement benchmarks average across account sizes, industries and formats that have nothing in common, and they are almost always quoted without their denominator attached. Using one to judge your own account is a coin toss dressed up as analysis, and it is the most common way a healthy account gets declared a failure.
There is also a size effect that is large and consistently ignored. Small accounts show much higher rates by followers than large ones, because a small audience is disproportionately made of people who chose to be there. An account of eight hundred beating an account of eighty thousand on rate is the normal case, not an achievement.
The benchmark worth having is five to ten real accounts of roughly your size doing roughly your job, read quarterly. A quarter smooths out the single post that travelled, and roughly your size removes the effect above. Follower growth alongside it keeps the whole thing honest, as follower growth rate sets out.
How Groowth does this
Groowth reads the public side of a profile once a day, which is exactly the set of inputs in the table above: what was published and when, the follower count, and the public likes and comments on each post. Nothing is connected, so a competitor and a colleague produce the same columns as your own account.
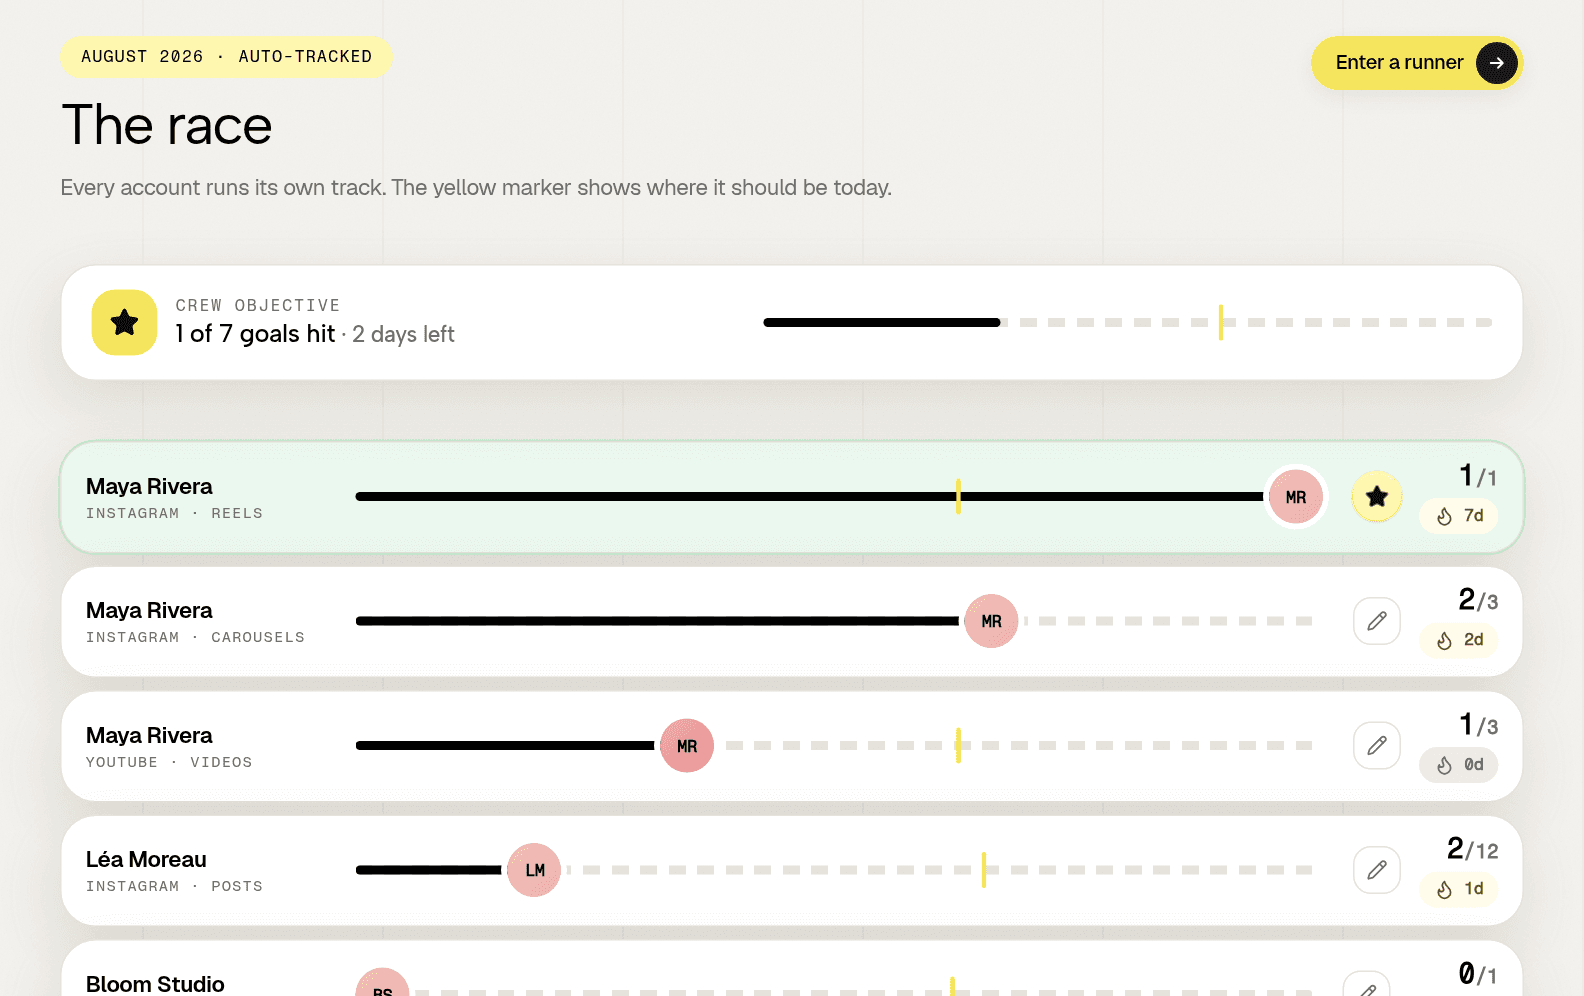
Because it reads daily it keeps the age problem out of the comparison, which a one off scrape cannot. It never reports reach, impressions or saves for an account it is not connected to, because those are not visible from outside and an estimate presented as a measurement is worse than an empty column. Three accounts are free with no card, and a free audit reads one public profile with no account at all.
Frequently asked questions
What counts as social media engagement?
Every action on a post other than seeing it, though each network fills that bucket differently and some include clicks, follows or long views. Because there is no shared definition, pick one, write it down and hold it for a year.
How is engagement rate calculated?
Reactions divided by an audience measure, and the choice of denominator changes the answer by an order of magnitude. Followers is the only denominator available for accounts you do not own, which makes it the default for comparison.
What is a good social media engagement rate?
Small accounts show higher rates because their audience chose to be there, so a small account beating a large one is the normal case. Compare against accounts of roughly your size, over a quarter rather than a month.